


StrateG Update - Week 33 - Q3 - 2023

CONTENTS
Overview of this week
Bitcoin - $BTC
2Y+ channel is broken
Bullish X
Horizontal resistance
Step-like formation
Altcap
Stocks
US Dollar Index (DXY)
Real Estate - Dutch Residential Property prices since 1970
Supermacro context
Bitcoin
SP500
US Dollar Index (DXY)
Please note that while I can provide information and insights based on my knowledge, it's important to remember that I cannot offer specific financial advice. #nfa
Overview of this week
Crypto-related News:
Argentina's presidential primaries have seen Javier Milei, a strong advocate for Bitcoin, emerge as the victorious candidate, marking a significant moment for the cryptocurrency industry.
Europe has introduced its first Spot Bitcoin ETF, named the Jacobi FT Wilshere Bitcoin ETF, which complies with regulations set by the Guernsey Financial Services Commission (GFSC) and is now listed on Euronext Amsterdam. This achievement comes two years after receiving approval.
The Dutch economy, ranking as Europe's fifth-largest, has officially entered a recession, recording a contraction of 0.3% during the second quarter of 2023. This marks the second consecutive quarterly decline, with the economy shrinking by 0.4% in the first three months of the same year.
Recent financial disclosures reveal that former President Trump holds a substantial $2.8 million worth of Ethereum.
In a significant development, the Chinese real estate behemoth Evergrande has filed for bankruptcy.
Bitcoin (BTC)
2Y+ channel - Update
This week, the price encountered resistance at the upper trendline of the descending channel. However, it's important to note that it has not only stayed above but also maintained the Higher-High-Higher-Low pattern established since November of the previous year. Despite falling below both the 200 S(W)MA and 200 S(D)MA, this structural integrity is a positive sign.
To truly change the narrative, the price would need to drop below $24.8k, which is currently not the case. Looking ahead, the upcoming weekly and monthly closings in August hold great significance. These will provide valuable insights into whether the price is likely to continue its upward trajectory or if this retracement is a healthy part of the overall trend.
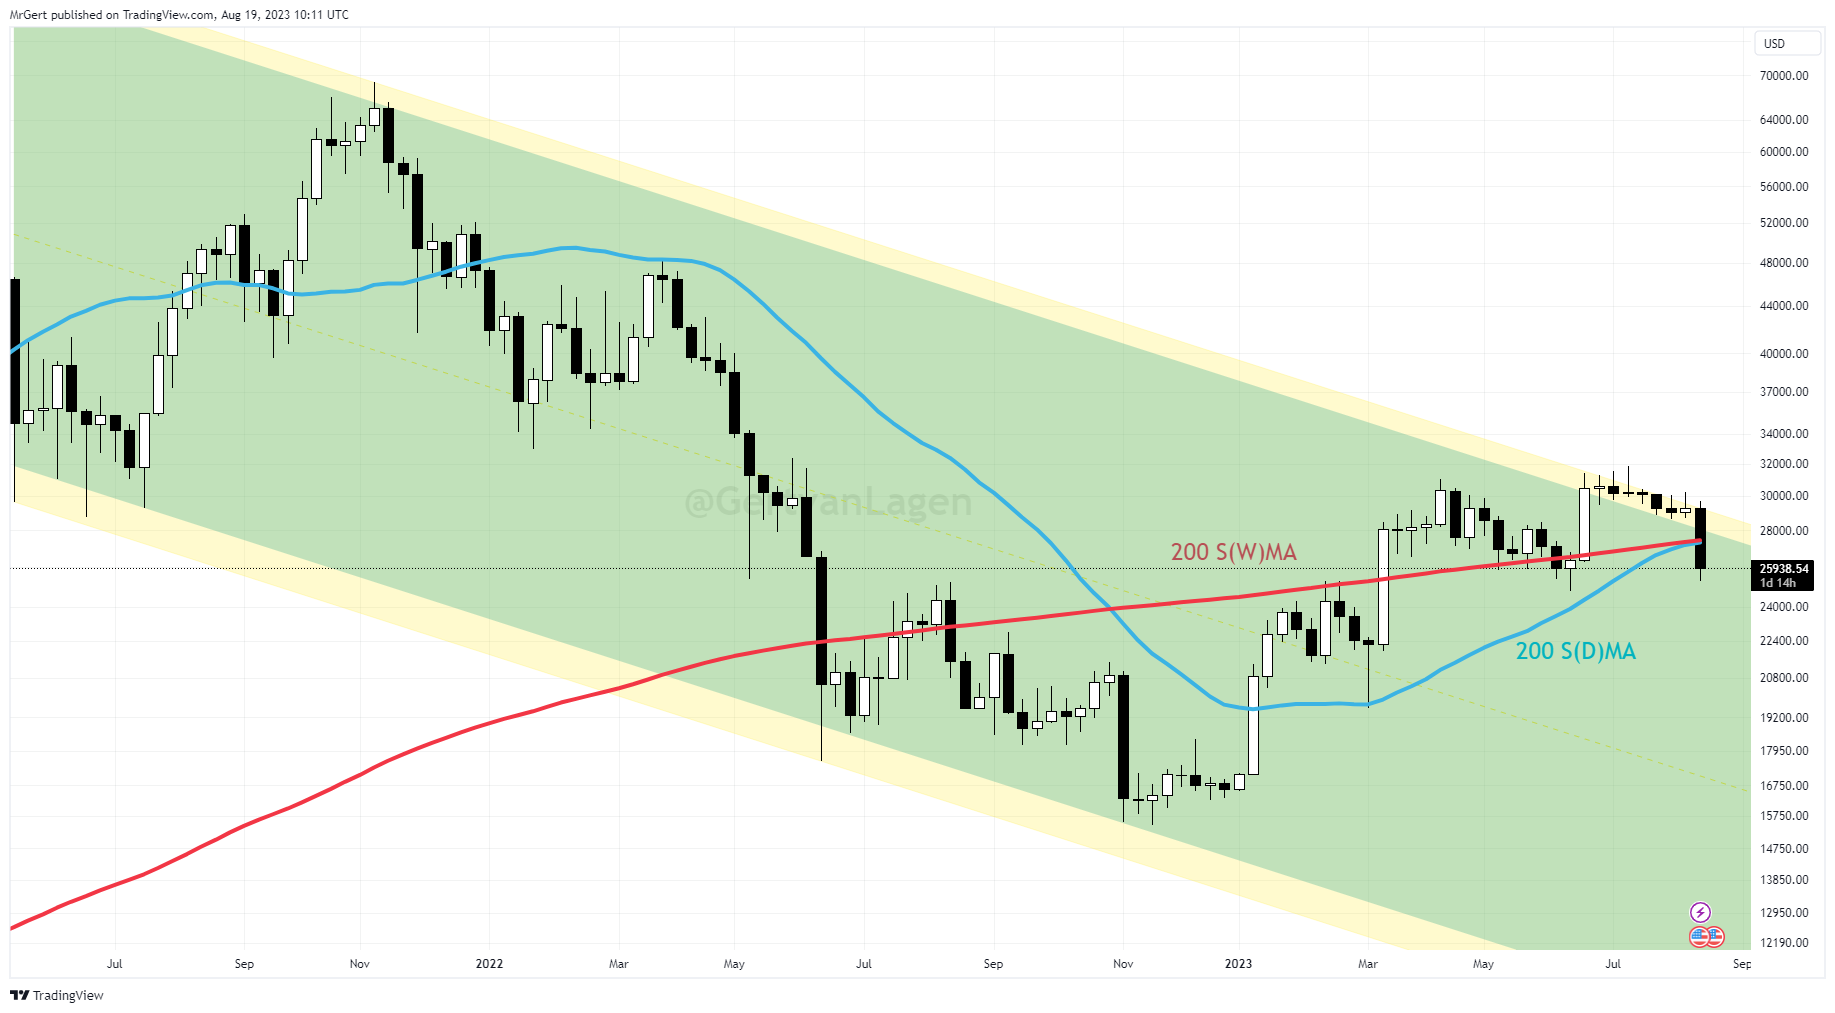
Bullish X - Update
As anticipated in last weeks analyses, the bullish cross between the 200 S(D)MA (blue line) and the 200 S(W)MA (red line) has become almost inevitable at this point in time. The two lines are now laying on top of each other, so the crossing can’t take months any more.
Step-like formation - Update
Bitcoin's recent price action has formed three subsequent bases since Q4/2022. Together they form the first impulse and first correction of the parabolic move I’m anticipating. Once consolidation of Base 3 is final, it looks final now, an impulsive bust to the 60k region in little time is to be expected based on the inline graph. [Green box]

From an Elliott Wave perspective, Bitcoin's current formation aligns perfectly:
Wave 1 (W1): Extends from Base 1 to Base 3.
Wave 3 (W3): Spans from Base 3 to Base 4.
Wave 5 (W5): Projects from Base 4 to the sell point.
The step-like formation Bitcoin is forming appears to be in the final stage of base 3.
Invalidation: Break below Base 3 into Base 2 zone.