


Strate𝔾 Update - Week 1 | Q1 | 2024
2024 starts with testing the bull case

Please note that while I can provide information and insights based on my knowledge, it's important to remember that I cannot offer specific financial advice. #nfa
Strate𝔾 Channel update December: LINK TO YOUTUBE
Key take aways
SEC decision on BTC ETF applications due next week.
Bitcoin tries tol clear $45k resistanceupward after multiple successful tests of $40k, parabolic move intact, next resistance $47.2k
Altcoins are still lagging a bit w.r.t. BTC
SP500 and Nasdaq-100 had great yearly close this week, Nasdaq-100 even closed the year above the previous all-time-high!
The dollar has dumped further, FED’s favorite inflation gauge came in lower than expected.
News of this week
The SEC is anticipated to make decisions on Spot Bitcoin ETF applications from January 8 to 10, with a Senior Bloomberg ETF analyst expressing optimism, stating it is nearing completion. All applicants for Spot Bitcoin ETFs have submitted their final 19b-4 Amendments. In the blocks below you can see the marketcap of Bitcoin in comparison with the Assets under Management by the different ETF applicants. This clearly shows the relevance of this decision, as these ETFs get launched, big money can easily get exposure to Bitcoin without taking on the risks of owning Bitcoin directly.

Several applicants for Bitcoin ETF approval have launched commercials.
The United States national debt has exceeded $34 trillion, marking a historic milestone.

Tweet of this week —> “12 spot #Bitcoin ETFs are no way priced in.”
Bitcoin (BTC)
Current status 100% Winning strategy: 🔵
When plotting the Bitcoin price data since 2009 on a symlog chart, it’s easy to see how the tops and bottoms can be linearly connected. Within the price structure, the most clean Elliottwave structure can be found. Waves ① through ⑤ are the first impulse wave of Bitcoin, where wave ③ is an extended wave containing subwaves (1)-(5), where subwave (3) is also extended containg subsubwaves 1-5. Also notice how wave ⑤ can be subdivided in 4 subwaves, where the 5th subwave is still lacking.

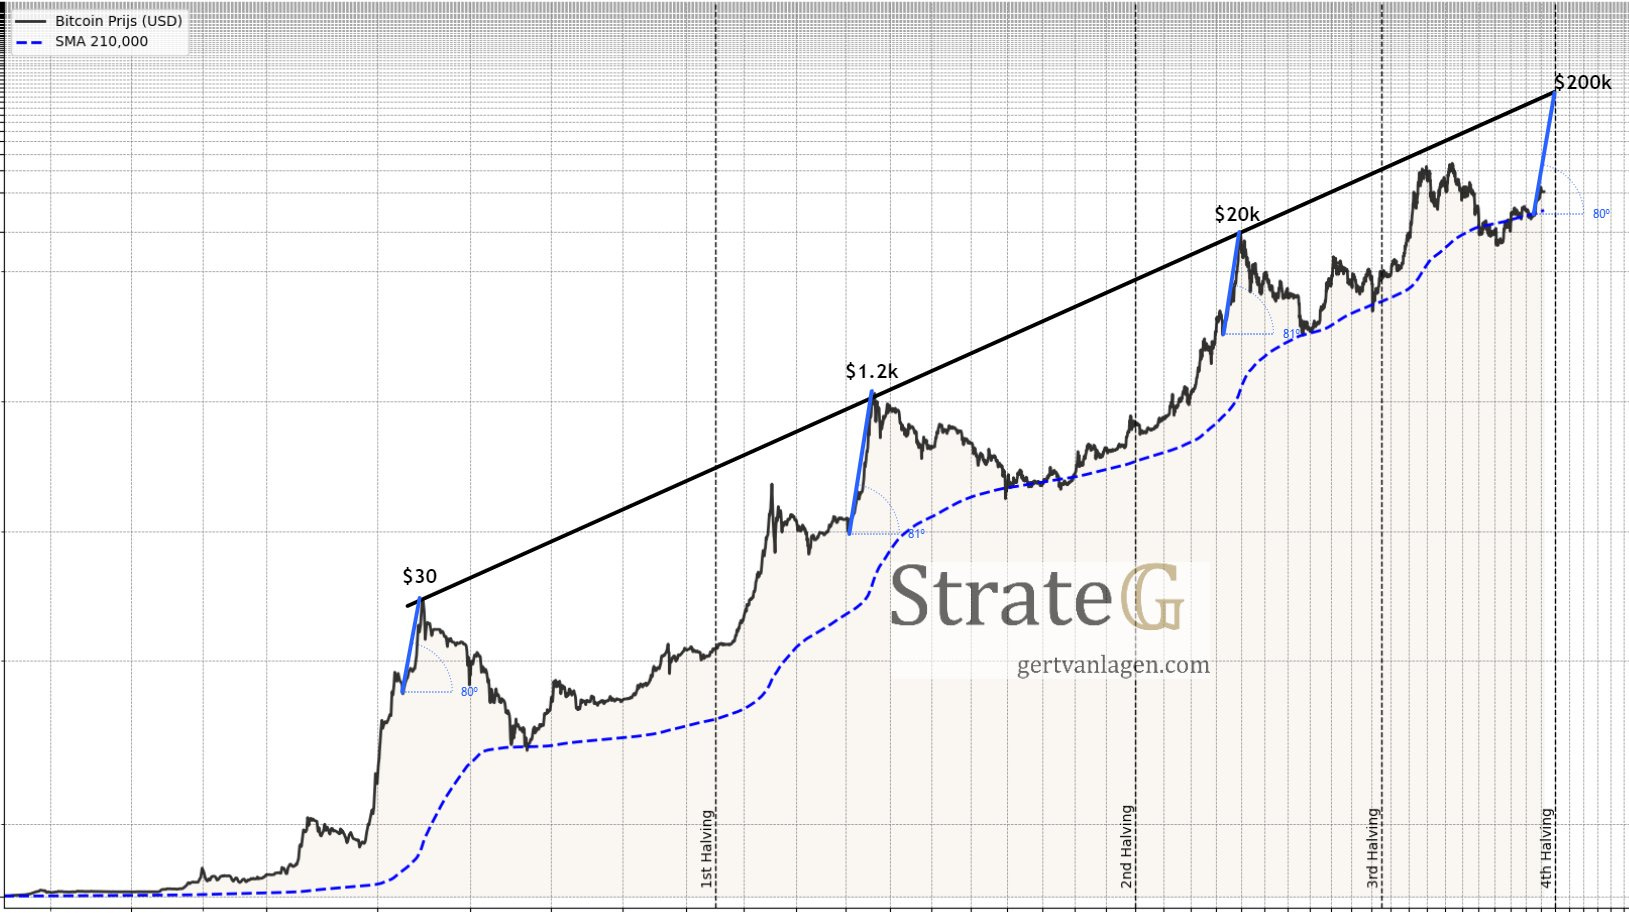
When drawing the trendline through the tops, it’s important to see that before each halving the black trendline was hit, unless this time. This is one reason why I’m anticipating a strong rally to $170-200k before the halving end of April this year.
When measuring the angle between the final dip before the previous blow-off rallies to the black trendline, an angle of about 80 degrees is found at the previous 3 occurrences. Projecting this angle starting at the $25k dip to the black trendline before the 4th halving yields a value of ~$200k.
Steve’s 5.3 Theory rejected
The chart below is self-explanatory.

A better Theory imho
Comparing the recovery and extension of the 2011, 2014 and 2018 bearmarkets, the following repeating structure is observed.