The information and insights are based on my knowledge; don’t take it as financial advice.
Economic Calendar
Mar-7, 13:30 UTC:
Unemployment Rate | Forecast 4 | Previous 4
The forecast is usually priced in, deviations when the actual value comes in tend to shake the markets with volatile movements.
Key Metrics
Current status 100% Winning strategy: 🔵—> ALL-IN
a weekly candle close below $72.9k would flash the black signal.
10Y-2Y Yield Spread is well above zero
market top before recession to be expected within 2.0 months
Bitcoin Dominance - Update
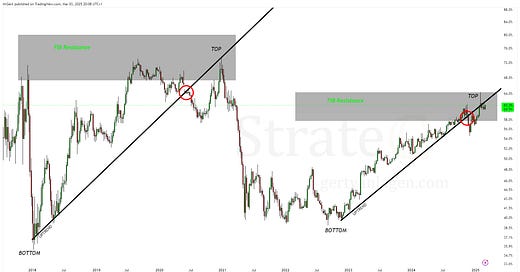
BTC.D follows the pattern, currently between 4 and 5:
Bottom: BTC.D at local minimum;
Uptrend: higher highs and higher lows;
Break trend: BTC.D falls below Fib Resistance
Bearish Retest: BTC.D tests Fib Resistance & uptrend -> actual TOP;
ALT SEASON.
Step-like Megaphone / iH&S
Bitcoin is currently retesting the neck line of the blue inverse Head and Shoulders pattern, after it broke above it and above Base 4. Compare the yellow crosses. The target of this iH&S pattern lies at around ~$300k, aligning with the HTF price target.
Important is that the weekly should not close below $72.9k, which would flash a strong bearish signal and cancel the prospect of a run-up to ~$300k.


