


Strate𝔾 Update - Week 2 | Q1 | 2024
Dusting off the weekly noise

Please note that while I can provide information and insights based on my knowledge, it's important to remember that I cannot offer specific financial advice. #nfa
Strate𝔾 Channel update December: LINK TO YOUTUBE
Key take aways
SEC approved 11 spot Bitcoin ETFs resulting in a lot of volatility
Bitcoin tests resistance zone centered at $47.2k for the first time, parabolic move intact.
Altcoins are still lagging a bit w.r.t. BTC, bit had a great green week.
SP500 and Nasdaq-100 had great weekly closes this week, both at their highest level ever!
The dollar has gone sideways, but is rolling over on lower timeframes.
News of this week
The SEC twice approved 11 spot Bitcoin ETFs, causing significant price volatility for BTC. However, the first approval was later revealed to be fake, as the tweet announcing it on the SEC's X-page was posted by a hacker. The FBI is currently investigating the authenticity of the SEC's clarification regarding this alarming case of market manipulation.
The Bitcoin halving is just 15,000 blocks away.
X plans to introduce peer-to-peer payments within the year.
BlackRock CEO Larry Fink asserts that Bitcoin is akin to digital gold and surpasses any government in significance.
December saw an overall YoY increase in US CPI to 3.4%, up from November's 3.1%, exceeding the estimated 3.2%.
US Core CPI (excluding Food/Energy) decreased to 3.9% YoY, marking the lowest core inflation reading since August 2021 and surpassing the anticipated 3.8%.
Tweet of this week —> “What a week in bond markets!”
Bitcoin (BTC)
Current status 100% Winning strategy: 🔵
This week a lot of ETF noise entered the Bitcoin chart, however without destructing the bullish higher high/ higher low structure since December 2022. In the chart below it’s clear that price tested the second to last resistance zone centered at $47.2k, and got rejected at first. Price is currently residing within the green Fibonacci support band of the rising channel starting EOY’22. It’s key to hold this zone, to prevent Bitcoin testing the lower support zone centered at $37.7k.

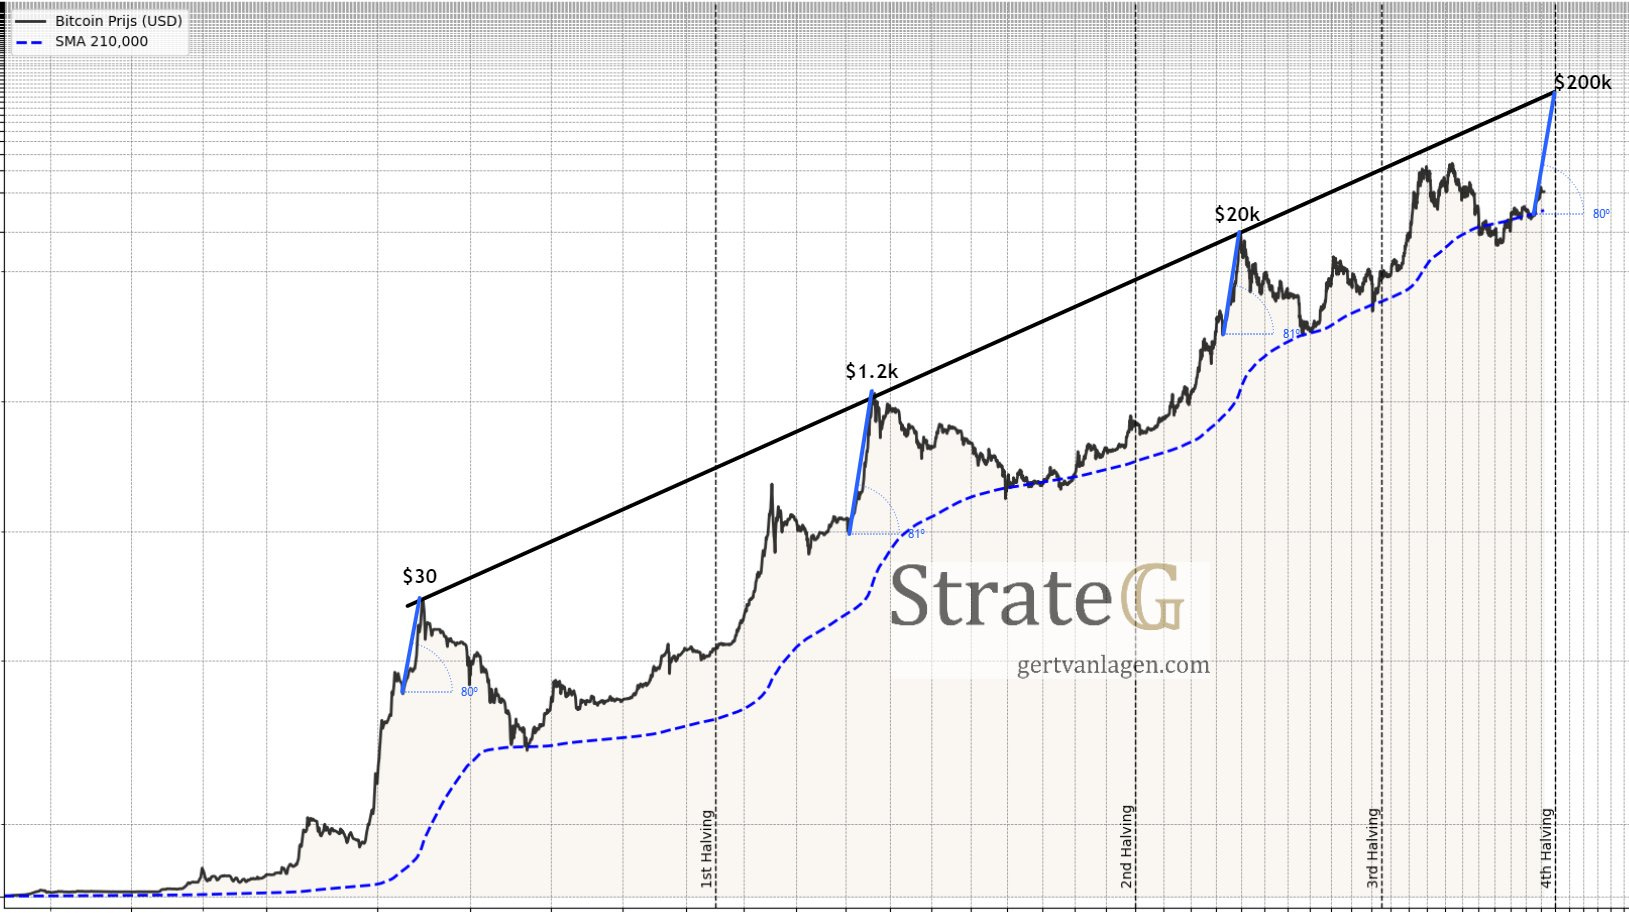
When drawing the trendline through the tops, it’s important to see that before each halving the black trendline was hit, unless this time. This is one reason why I’m anticipating a strong rally to $170-200k before the halving end of April this year.
When measuring the angle between the final dip before the previous blow-off rallies to the black trendline, an angle of about 80 degrees is found at the previous 3 occurrences. Projecting this angle starting at the $25k dip to the black trendline before the 4th halving yields a value of ~$200k.
1.618 → 2.272 Theory (update)
Comparing the recovery and extension of the 2011, 2014 and 2018 bearmarkets, the following repeating structure is observed.
🟢 First Struggle to overcome the 0.618-0.786 before ATH.
🔴 Second Struggle to overcome the 1.618 extension resistance.
When breaking through the 🔴 1.618 resistance, previous 2 times price flew within 1-3 months to its next cycle top at around the 2.272 extension. Guess what, the 2.272 extension of the 2018 bearmarket lies at $205k.

2Y+ channel - Update
Price keeps tracking the parabolic surge of W5 before the halving. After the struggle of months (compare red circles), Bitcoin has succeeded to overcome the gravitation of the 2.25Y+ descending channel. This week the Mar’22 high was defeated with BTC printing a higher high.

The main Fibonacci extension targets of W4 are at $150k, $170k and $220k, where the last one aligns closely with the upper trendline of the supermacro channel.
It's important to note that W5, being a blow-off wave, might exhibit a steep ascent as depicted, but the key point is that there's one final impulse left.
Here the updated chart:
Elliottwave count:
W1: 1st impulse
W2: 1st correction (zigzag, sharp)
W3: 2nd impulse (momentum)
W4: 2nd correction (expanded flat)
W5: 3rd impulse (blow-off, next up)