CONTENTS
Overview of this week
Bitcoin - $BTC
Shortterm Elliott Wave
2Y+ channel
Step-like formation
Ethereum - $ETH
Altcap
Stocks 🎈
US Dollar Index (DXY)
Supermacro context
Bitcoin
SP500
US Dollar Index (DXY)
Please note that while I can provide information and insights based on my knowledge, it's important to remember that I cannot offer specific financial advice. #nfa
News of this week
Crypto:
Cboe, the largest options exchange in the US, is set to launch margined futures for Bitcoin and Ethereum.
Boyaa, China's largest board and card game company, plans to acquire $90 million worth of Bitcoin and Ethereum.
Commerzbank, Germany’s fourth-largest bank, has been granted a cryptocurrency custody license.
BlackRock files an S-1 application for its Spot Ethereum ETF.
Fidelity, a $4.5 trillion asset manager, files for a Spot Ethereum ETF.
South Korea’s National Pension Service, the world’s third-largest pension fund, purchases $19.9 million worth of Coinbase shares.
Other
US inflation falls to 3.2%, which is below expectations.
Argentina experiences a significant rise in inflation, reaching 143%.
The Managing Director of the International Monetary Fund (IMF) suggests that central bank digital currency (CBDC) could replace cash.
Tweet of this week —> “Enjoyed dropping Elliottwave bombs on Dutch crypto maestros this week at the Bybit”
Bitcoin (BTC)
In May, I presented a Wyckoff accumulation setup for Bitcoin, mirroring the textbook example in the lower right corner. On the lower timeframe, there was a smaller accumulation phase indicated by the blue box, which I identified in November 2022.
Now phase E is evidently underway, but the markup phase experienced a slight delay due to the second test at the 25k level. This serves as a noteworthy illustration of a previous resistance point (25k) being transformed into support and subsequently tested multiple times on a high timeframe before the markup phase commences.
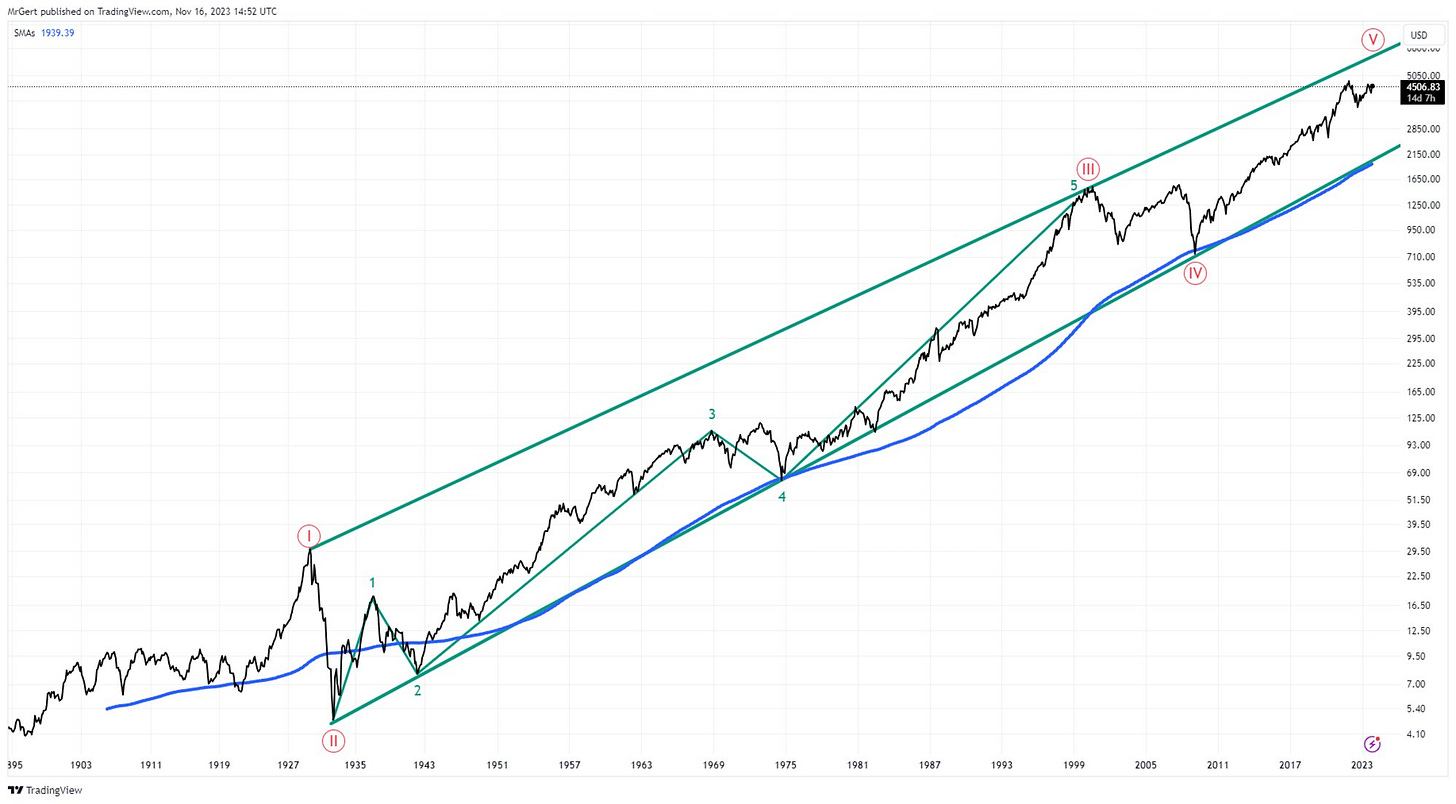
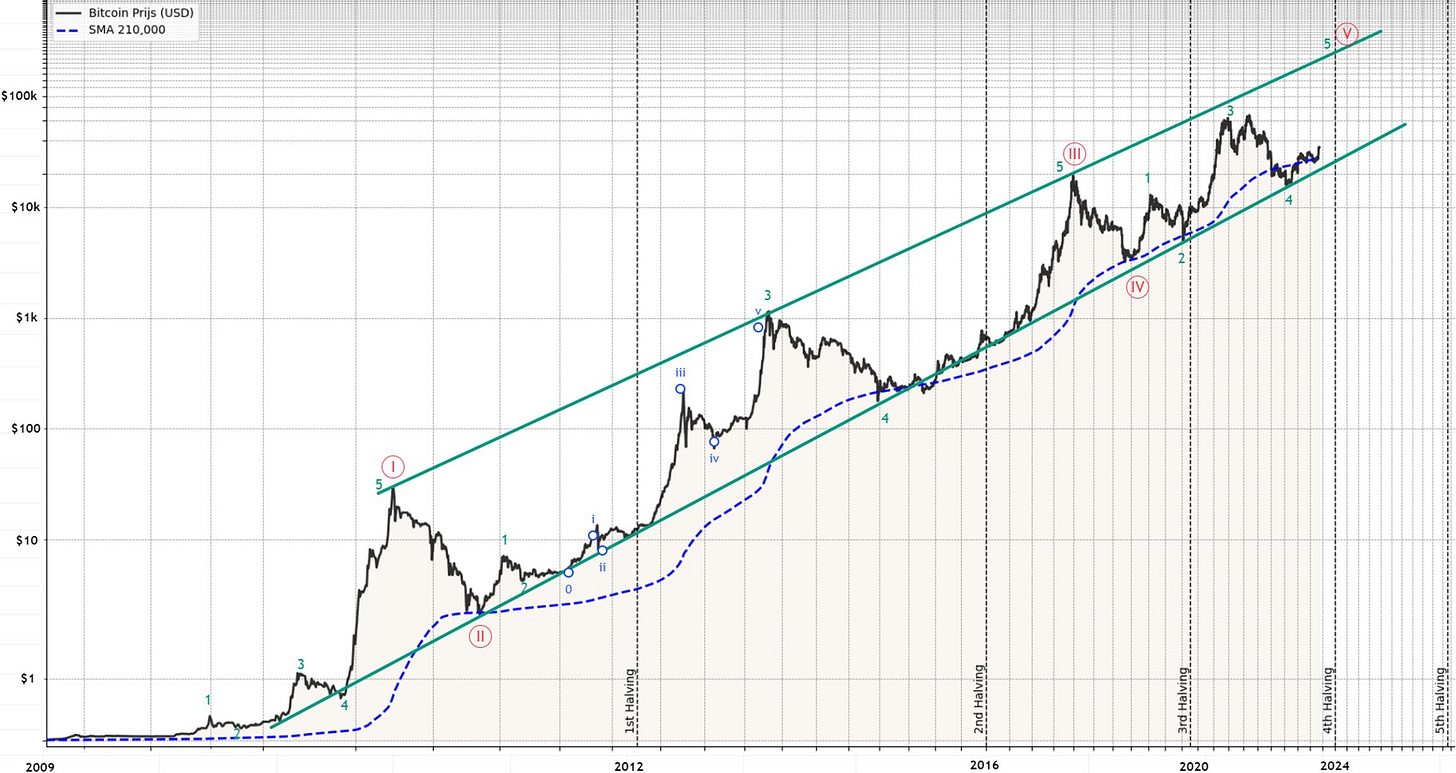
The SP500 in the range of 1880-2030 and BTC from 2009-2024 are aligning for a final blow-off towards the upper green trendline of their logarithmic channels. When the upper green line is reached (approximately 200k for BTC and around 6000 for SPX), a recession is anticipated. Confirmation is sought through the analysis of yield curves and Sahm's rule, will keep an eye on those for y’all.
It’s nice to observe that the target of the lower timeframe structures are pointing exactly to those upper trendlines. With this week the CPI coming in lower than expected, chances are increasing for the FED to pause/hike rather than increasing their interest rates this year. Markets reacted enthousiastically on the news.
2Y+ channel - Update
The parabolic surge of W5 has started. After the struggle of months (compare red circles), Bitcoin has succeeded to overcome the gravitation of the 2.25Y+ descending channel.
This week I’ve included th main Fibonacci extension targets of W4 at $150k, $170k and $220k, where the last one alines closely with the upper trendline of the supermacro channel, see → Supermacro Context
It's important to note that W5, being a blow-off wave, might exhibit a steep ascent as depicted, but the key point is that there's one final impulse left.
Here the updated chart:


