


Strate𝔾 Update - Week 3 | Q1 | 2024
Risk-on confirmed!

Please note that while I can provide information and insights based on my knowledge, it's important to remember that I cannot offer specific financial advice. #nfa
Strate𝔾 Channel update December: LINK TO YOUTUBE
Key take aways
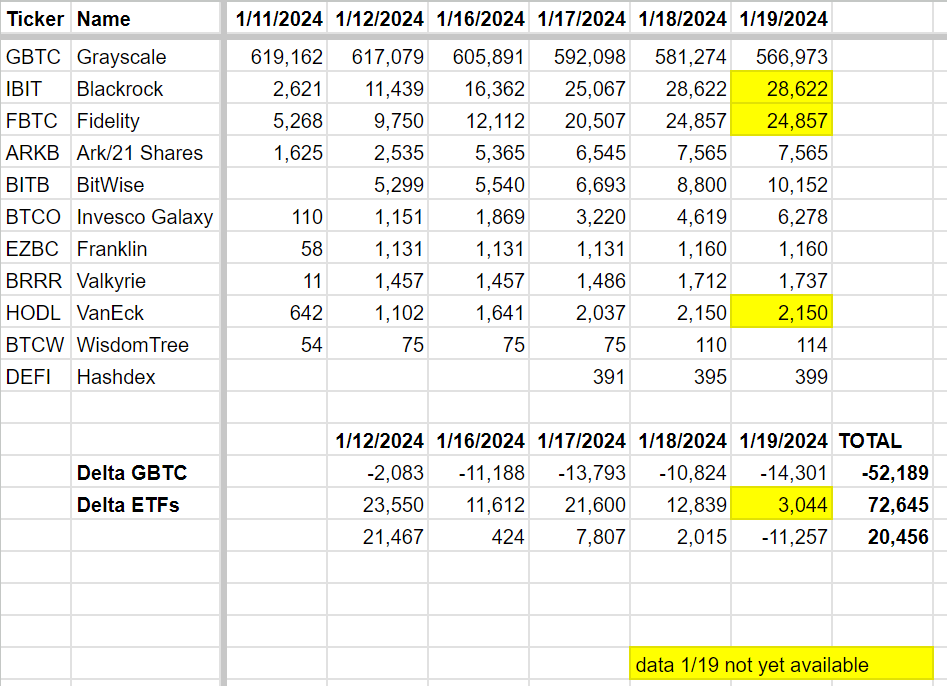
GBTC outflows minimize the effect of the Bitcoin ETFs in the first week.
Stocks rally to ATH’s.
The blowoff top has arrived for stocks as both S&P 500 as Nasdaq-100 have reached new ATH’s this week and closed the week at those higher levels.
News of this week
Nasdaq-100 and S&P 500 print ATH’s, jump to update 🎈🎈
Within a single week Bitcoin becomes the second largest ETF commodity in the US, surpassing silver.
SEC delays decision for Fidelity's spot Ethereum ETF.
In the first week of the Bitcoin ETFs a total of at least 72,645 BTC was added to the 11 funds, at the moment representing a worth of 3 billion USD. At the same time there was a lot of outflow from the GBTC fund -52,189 BTC, representing 2.2 billion USD. So the net effect of the ETF approvals was significantly suppressed by enormous sell-pressure from the GBTC fund. Note that in this overview the IBIT, FBTC and HODL funds have not reported on Jan-19 yet. Some reasons for the outflows are:
GBTC has a 2% fee, the new ETFs roughly of about 0.25%
GBTC traded a long time lower than the actual BTC price. This ‘discount’ has now been largely consumed, so investors are either taking profits or moving their money into the more attractive spot Bitcoin ETFs

Tweet of this week —> “Bitcoin isn't into a bear market; it's at the start of a new bull cycle.”
Bitcoin (BTC)
Current status 100% Winning strategy: 🔵
This week a lot of GBTC sell pressure entered the Bitcoin chart, however without destructing the bullish higher high/ higher low structure since December 2022.
In the chart below it’s clear that price tested the second to last resistance zone centered at $47.2k, and got rejected at first. Price is expected to close this week within the green Fibonacci band within the rising channel, initiated EOY’22. It’s key to hold this zone, to prevent Bitcoin testing the lower support zone centered at $37.7k.

Zooming in a bit on the daily chart shows that price is still printing Higher highs and higher lows, reminiscent of the 30.8k-24.8k-31.8-24.9k chop on the weekly timeframe last year.


Zooming out a bit and plotting the Bolling Bands on the logarithmic chart, yields the following observation:
When after a bear market, price was able to close the monthly candle above the upper bollinger band, a parabolic move always followed. Please compare the green stars, at previous occurrences.
The good news, Dec-23 closed well above this upper bollinger band, indicating the start of a parabolic runup.

1.618 → 2.272 Theory (update)
Comparing the recovery and extension of the 2011, 2014 and 2018 bearmarkets, the following repeating structure is observed.
🟢 First Struggle to overcome the 0.618-0.786 before ATH.
🔴 Second Struggle to overcome the 1.618 extension resistance.
When breaking through the 🔴 1.618 resistance, previous 2 times price flew within 1-3 months to its next cycle top at around the 2.272 extension. Guess what, the 2.272 extension of the 2018 bearmarket lies at $205k.
Here the updated chart:

2Y+ channel - Update
Price keeps tracking the parabolic surge of W5 before the halving. After the struggle of months (compare red circles), Bitcoin has succeeded to overcome the gravitation of the 2.25Y+ descending channel. This week the Mar’22 high was defeated with BTC printing a higher high.

The main Fibonacci extension targets of W4 are at $150k, $170k and $220k, where the last one aligns closely with the upper trendline of the supermacro channel.
It's important to note that W5, being a blow-off wave, might exhibit a steep ascent as depicted, but the key point is that there's one final impulse left.
Here the updated chart:
Elliottwave count:
W1: 1st impulse
W2: 1st correction (zigzag, sharp)
W3: 2nd impulse (momentum)
W4: 2nd correction (expanded flat)
W5: 3rd impulse (blow-off, next up)
Flat correction?
Regarding the nature of the correction, yes, W4 retraced only 50% of W3 in a complex expanded flat pattern of ABC. In contrast, W2 was a sharp zigzag correction, retracing 90% of W1.
Step-like formation - Update
The ETF approval catapulted BTC to a new high at $49k. BTC still follows the parabolic structure to reach $200k before May this year. The long awaited impulsive bust to $60k+ in the shortest period of time has started. In the mean time price is far above Base 3 already and on it's way to Base 4. Note that the sketched trajectory is a structural expectation, not exactly timewise.
Here the updated chart:

Elliottwave count:
Wave 1: Base 1 to Base 3
Wave 2: Base 3 (Flat)
Wave 3: Base 3 to Base 4
Wave 4: Base 4 (Likely sharp)
Wave 5: Base 4 to SELL POINT