


Strate𝔾 Update - Week 18 | Q2 | 2024
Stocks and crypto bounce, US dollar tanks

Please note that while I can provide information and insights based on my knowledge, it's important to remember that I cannot offer specific financial advice. #nfa
News of this week
Federal Reserve Chairman Jerome Powell announces a pause in interest rate hikes, maintaining rates between 5.25% and 5.50%. He also mentions that rate cuts will be appropriate when labor market collapses (due to recession) or when the FOMC gets more proof that inflation keeps cooling down to the 2% target.
This gives more room for the blow-off top to further play out, because rate cuts are associated with the start or with a measure against a recession.
Hong Kong commences official trading of spot Bitcoin and Ethereum ETFs.
BNP Paribas, Europe's second-largest bank, invests in BlackRock's spot Bitcoin ETF.
BlackRock predicts that sovereign wealth funds, pension funds, and endowments will soon engage in spot Bitcoin ETF trading.
Binance CEO Changpeng Zhao receives a four-month prison sentence.
Australia plans to introduce spot Bitcoin ETFs by the end of 2024.
Tweet of this week —> “Just leaving this here”
Current status 100% Winning strategy: 🔵—> ALL-IN
Bitcoin
In the chart below, the supply last active 1 year or longer ago is depicted in orange, while the price action of Bitcoin is shown in black. Note that during long bear markets, the orange chart steadily climbs due to accumulation and stubborn holding. Once the previous all-time high (marked by the red circle) is surpassed, the orange chart is rolls over, indicating distribution from long-held coins to exit liquidity. This rollover is typically accompanied by a steep increase in price as a result of the prolonged accumulation before. Subsequently, the dominance of distribution of long-term held coins becomes predominant, leading to a price rollover into the next bear market.
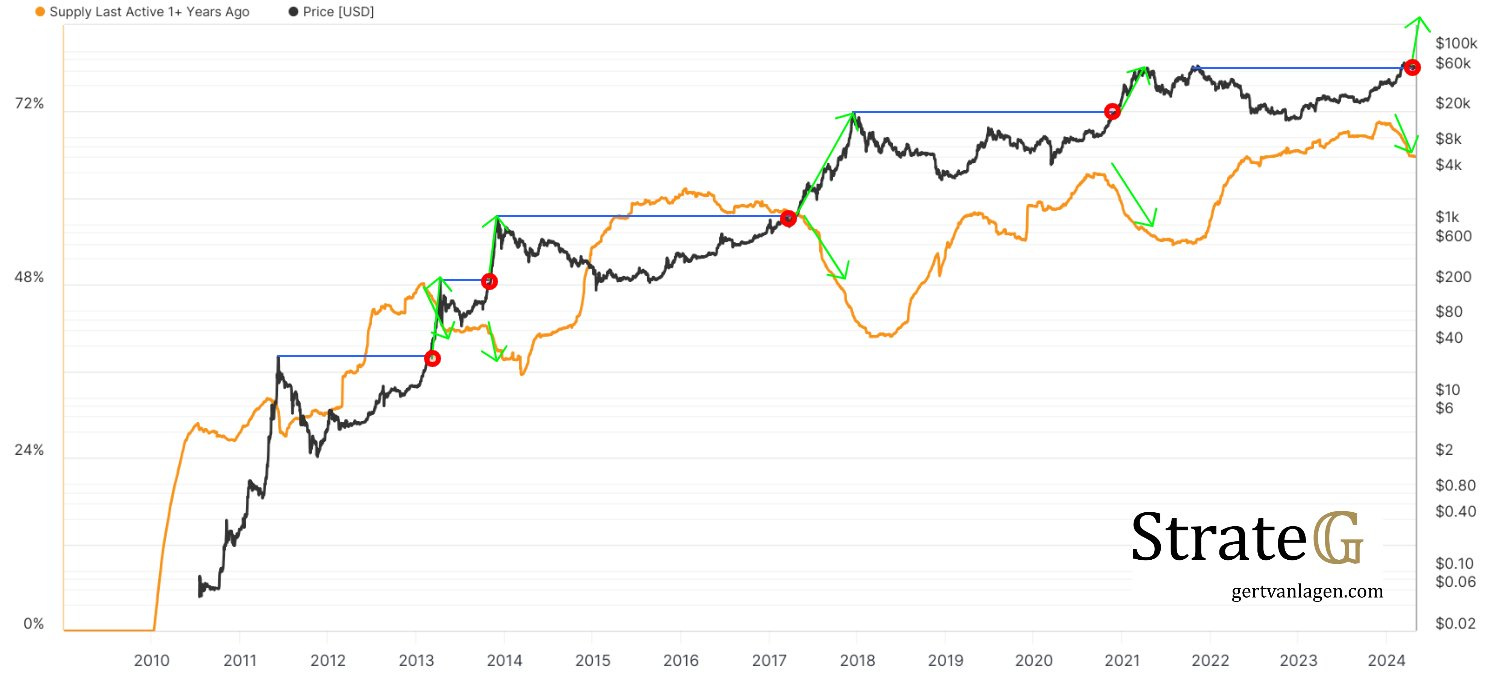
Currently price has already printed a new ATH (red circle) and the orange chart is rolling over. This combination has historically always led to a quick parabolic surge followed by a prolonged bear market.
Comparing cycles A, B, and C

All experienced rejection at the 78.6% Fibonacci level.
Cycle A encountered a robust rejection at the 161.8% bear market extension.
Cycle C faced a double rejection at the 161.8% bear market extension, which has been successfully tested over the course over the past week
Cycles A and B both peaked near the 227.2% extension while the RHODL ratio signaled a macro top too (red zone in chart below).
Note that the 2021 tops didn’t flash a macro top on the RHODL ratio chart, comparable to the 2013 mid-cycle top at the 161.8% bearmarket extension. In my opinion this shows that Cycle C did not end in 2021, but is still to be finalized by a final wave up to the 227.2% extension.
