Please note that while I can provide information and insights based on my knowledge, it's important to remember that I cannot offer specific financial advice. #nfa
News of this week
T-mobile, the worlds largest telecom company announced that they are currently running Bitcoin nodes and they are planing to launch into Bitcoin mining.
BlackRock holds 305,568 $BTC, valued at over $20 billion, for their spot #Bitcoin ETF.
ICBC, the world's largest bank, states that "#Bitcoin retains the scarcity similar to gold" and labels Ethereum as "digital oil," recognizing its role in powering the digital future.
Former President Donald Trump asserts that "#Bitcoin mining may be our last line of defense against a CBDC," and advocates for Bitcoin production in the USA. He vows to "end Joe Biden's war on crypto" and ensure that the future of crypto and #Bitcoin is American-made.
US inflation drops to 3.3%, below the expected 3.4%.
The Moscow Stock Exchange in Russia has officially stopped trading in US Dollars and Euros.
The Federal Reserve halts interest rate hikes, maintaining rates at 5.25% - 5.50%.
MicroStrategy plans to raise $500 million for purchasing Bitcoin.
A spot Ethereum ETF is anticipated to launch by July 2nd, according to a Bloomberg ETF analyst.
Tweet of this week —> “You're looking at the first breakout of Bitcoin against M1 money supply since March 2017 when it went historically parabolic for 9 months.”
Current status 100% Winning strategy: 🔵—> ALL-IN
a price drop to $45,6k would flash the black signal.
Bitcoin
The Choppiness Index is a volatility indicator to indicate whether a market is trending or ranging. Values range between 0 and 100, with low values indicating a strong trend and high values signaling consolidation.
The Choppiness Index is currenly peaking at levels only seen just before BTC expanded beyond major cycle ATHs with huge volume. The thicker the candle, the higher the volume.
US Unemployment Rate starts rising significantly again after printing a 70 year low. Recession is looming. Look at all previous rounded bottoms and how little time it took for a recession to swing in.
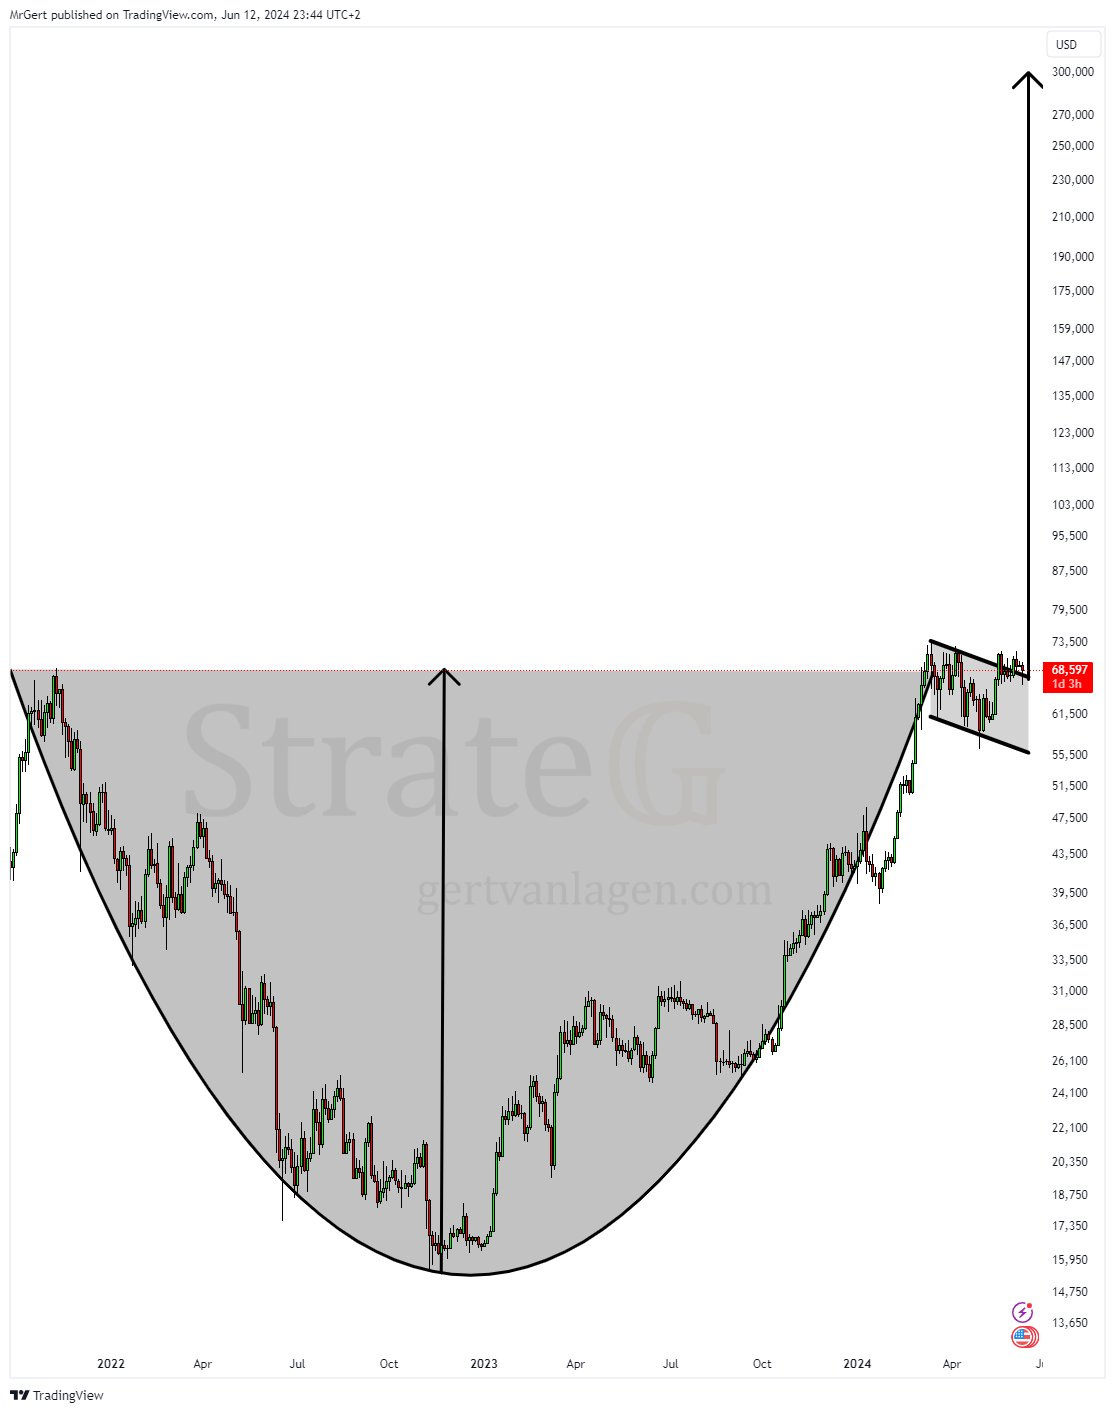
Bitcoin on the 3-day chart is exhibiting a "cup with handle" pattern, targeting $300,000. The price has broken out of the handle/bull flag formation and has successfully retested this breakout over the past four weeks. The logarithmic plot conceals the actual depth of the little handle which is actually 33% of the cup height.
Cup height = 69k-15.4K=53.6k
Handle depth = 74k-56.4K=17.6k
17.6k/53.6k=0,33= 1/3
Feel free to call it a rounded bottom with a little resistance left around the previous ATH, just like the 3 year cup from 2014-2017. The target was well hit on log, and the handle contained a -34% dip.
Two weeks ago the following two scenario’s were discussed. Price has not yet made a decisive move for one of the scenarios to get invalidated.:
Correction 3-4 on the right chart is already final, blow-off wave 5 is about to kick in. ATH needs to be broken for this. Peak target lies between ~$235k-$260k
Correction 3-4 on the right isn’t final, first another leg down is next, wave C. After that blow-off wave 4-5 kicks in. Peak target lies between ~$260k-$330k


