Strate𝔾 Update - Week 9 | Q1 | 2024
"Bitcoin's February close paves the way for a parabolic surge towards a repetitive staccato of fresh all-time highs in March."
Please note that while I can provide information and insights based on my knowledge, it's important to remember that I cannot offer specific financial advice. #nfa
Strate𝔾 Channel update January: LINK TO YOUTUBE
Key take aways
Alts are gearing up to follow BTC’s lead.
Both S&P 500 and Nasdaq-100 printed new ATH’s this week and had a strong weekly close.
I'd love to hear your thoughts or any suggestions you have for this newsletter! What rabbit hole should be explored in the next release?
News of this week
The price of Bitcoin surged to $64,000 this week, marking the second-highest monthly candle close ever. Just one week ago, it was at $50,500.
The White House has voiced concerns about Bitcoin mining, citing its significant strain on the power grid, according to Fox Business.
Coinbase experienced a software hick-up this week, due to huge data traffic, making Bitcoin plunge ~$6k in price within half an hour.
Morgan Stanley, a $1.3 trillion asset manager, is now exploring the possibility of offering spot Bitcoin ETFs to its customers.
Bitcoin has overtaken the Russian Ruble to become the world's 14th largest currency.
Wells Fargo and Bank of America's Merrill Lynch have started offering Bitcoin ETFs to their clients.
The Chief Investment Officer at Bitwise predicts that Bitcoin could reach anywhere from $100,000 to $200,000 or even higher by 2024 due to high demand and limited supply.
Tweet of this week —> “Right, 500m is only about 0.5% of the daily BTC trading volume of 96b.”
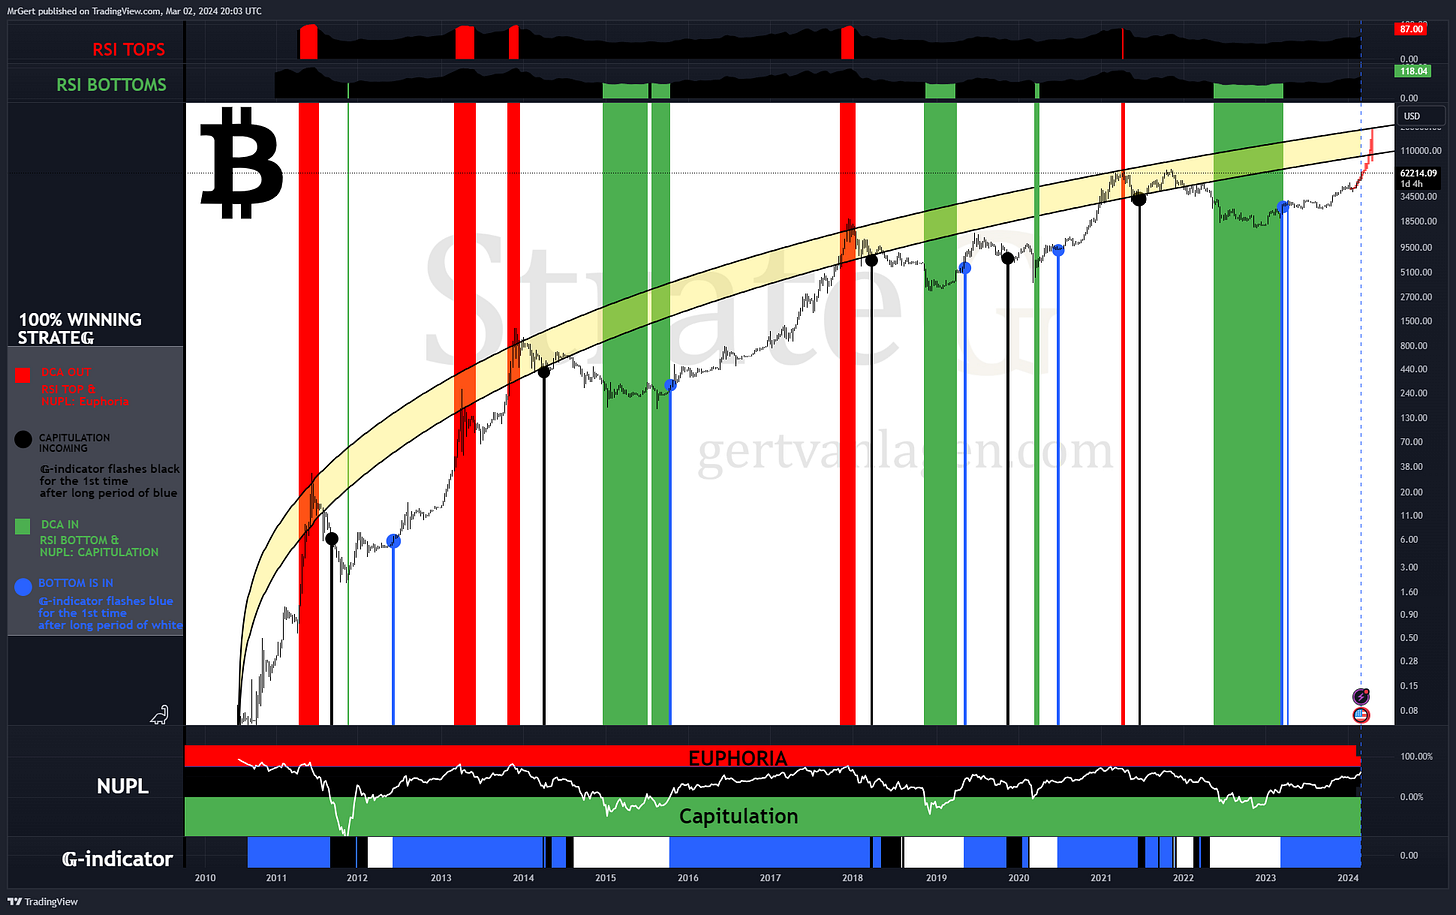
Current status 100% Winning strategy: 🔵—> ALL-IN
Bitcoin (BTC)
As anticipated Bitcoin keeps roughly following the structural trajectory of the S&P 500 and has hit the $64k level this week. A fresh ATH for BTC is almost inevitable now in the coming weeks.
Bitcoin's February close significantly above the 78.6% Fibonacci level paves the way for a parabolic surge towards a repetitive staccato of fresh all-time highs in March.
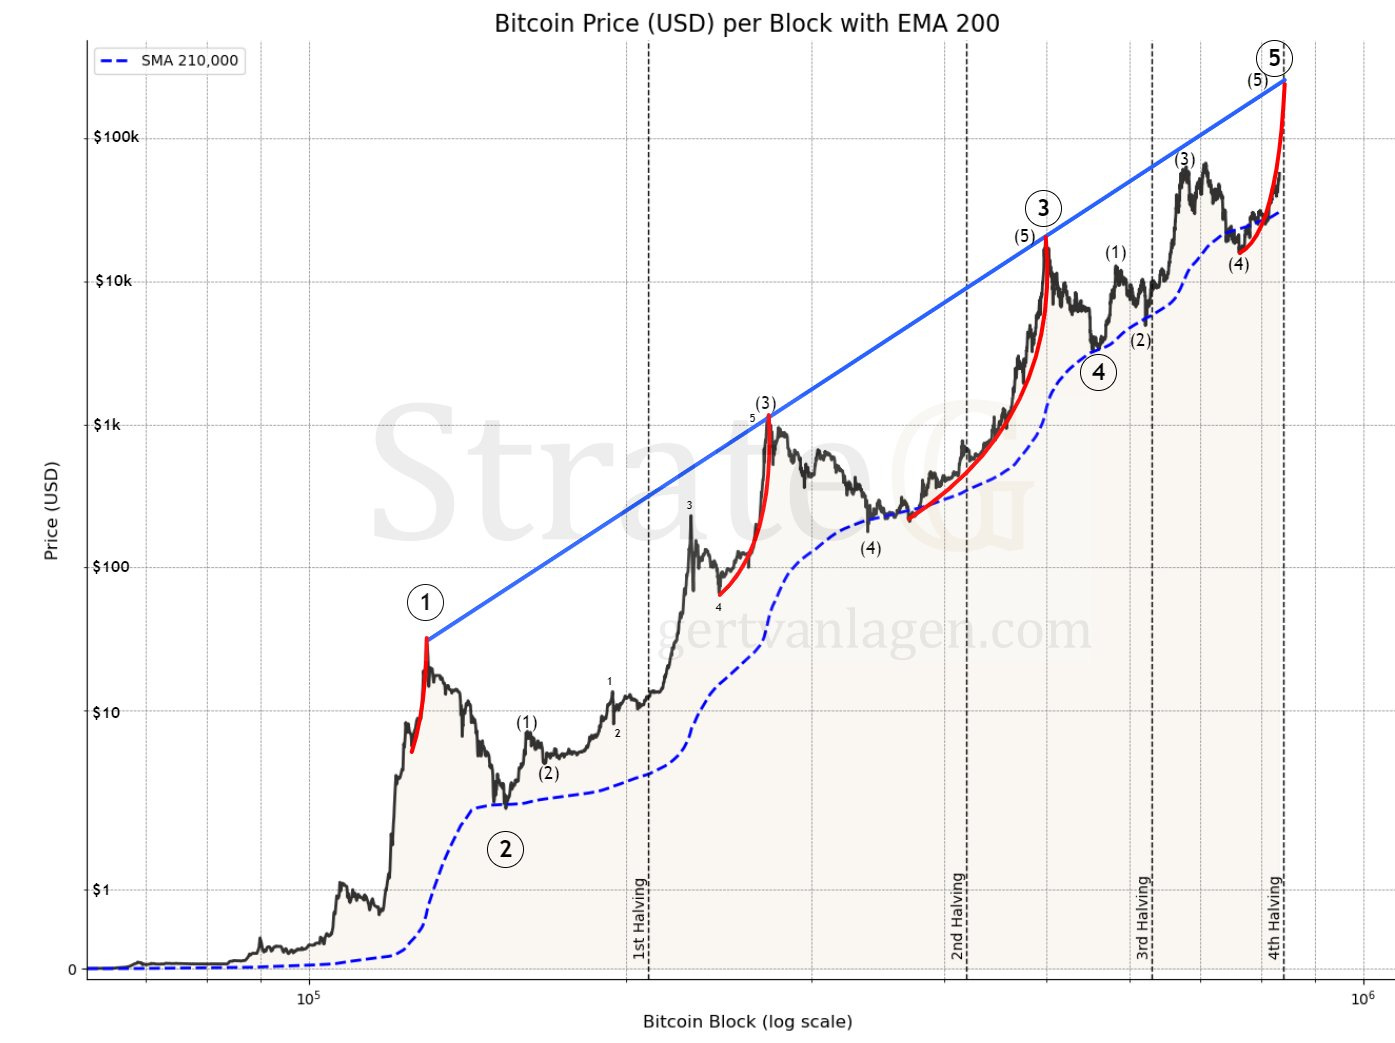
The green hands point to similar occurrences observed during previous bear market recoveries. Comparing these events in relation to their nearest halving reveals that, this time, the price has already reached a recovery level unprecedentedly close to a halving. With approximately two full months remaining before the halving, it becomes increasingly likely that the price will peak much sooner than most people would anticipate when comparing previous post-halving price trajectories. One might wonder why this is the case. Well, while the halving holds significant importance for miners, it does not have an immediate major effect on the supply. Furthermore, the supply effects are overshadowed by the fact that Bitcoin ETFs alone are accumulating at a rate 10 times faster than BTC brought into circulation.
After all, it would be unprecedented if price would not surge to $200k before the halving. The current 5th blow-off wave has NOT YET hit the blue trendline before the 4th halving at $200k, but each blow-off top in the past did hit this blue trendline prior to each previous halving, compare the red parabolas.
As formidable as this move appears, the extended period during which the price has remained below the 210,000 blocks SMA at 4 signifies weakness, a factor I anticipate will materialize once the price has completed its blow-off phase.
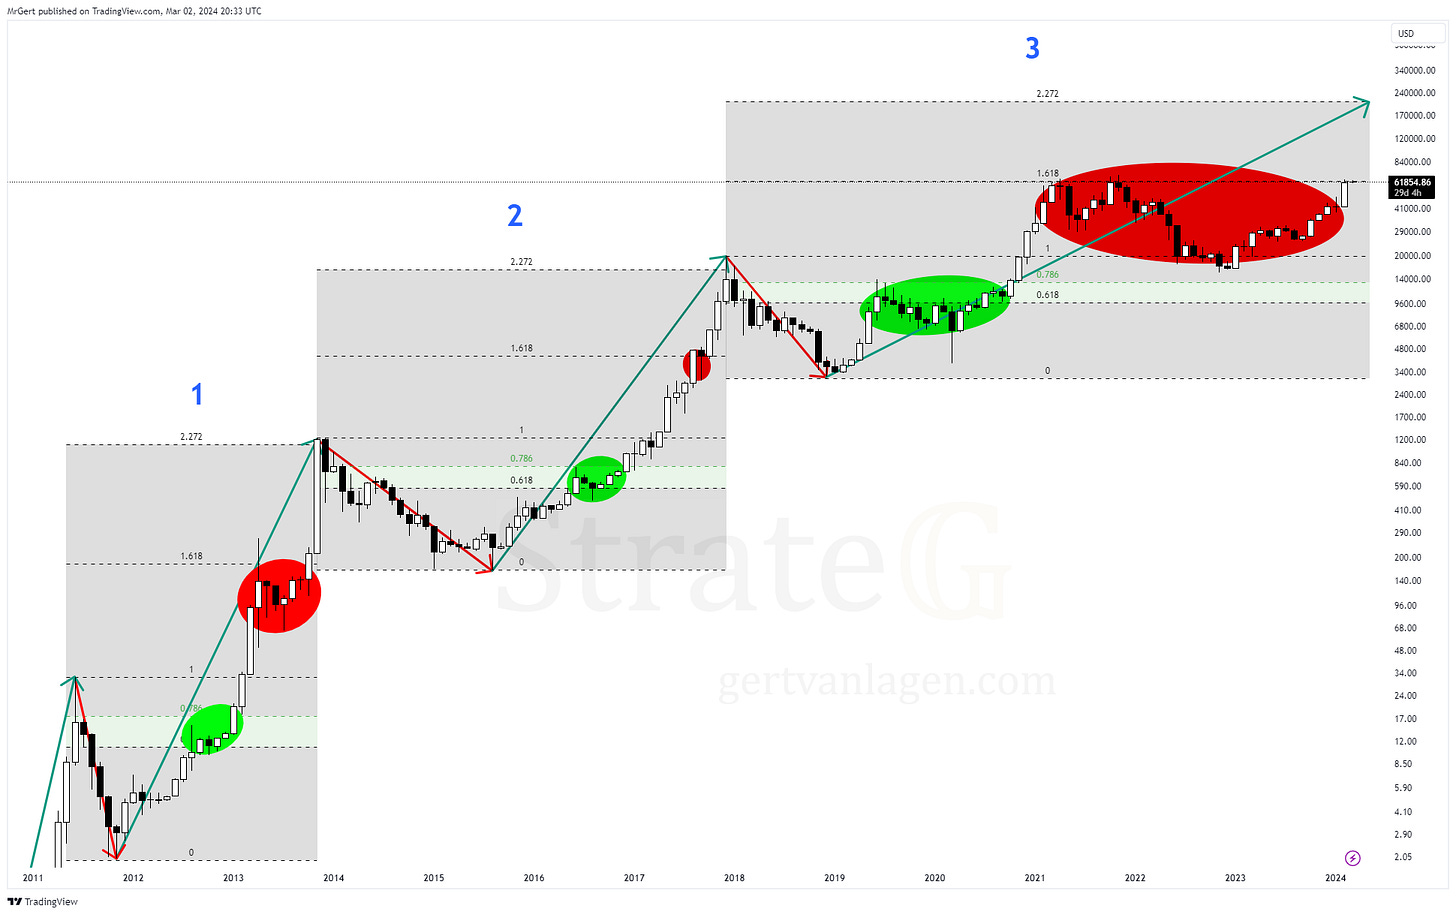
1.618 → 2.272 Theory (update 🎈)
$BTC has broken the 1.618 extension of the 2018 bear market! Previous two cycles when this happened, price topped within 2-3 months at the 2.272 extension. The 2.272 extension currently lies at $207k.
Comparing the recovery and extension of the 2011, 2014 and 2018 bear markets, the following repeating structure is observed.
🟢 First Struggle to overcome the 0.618-0.786 before ATH.
🔴 Second Struggle to overcome the 1.618 extension resistance.
Here the updated chart:
2Y+ channel - Update
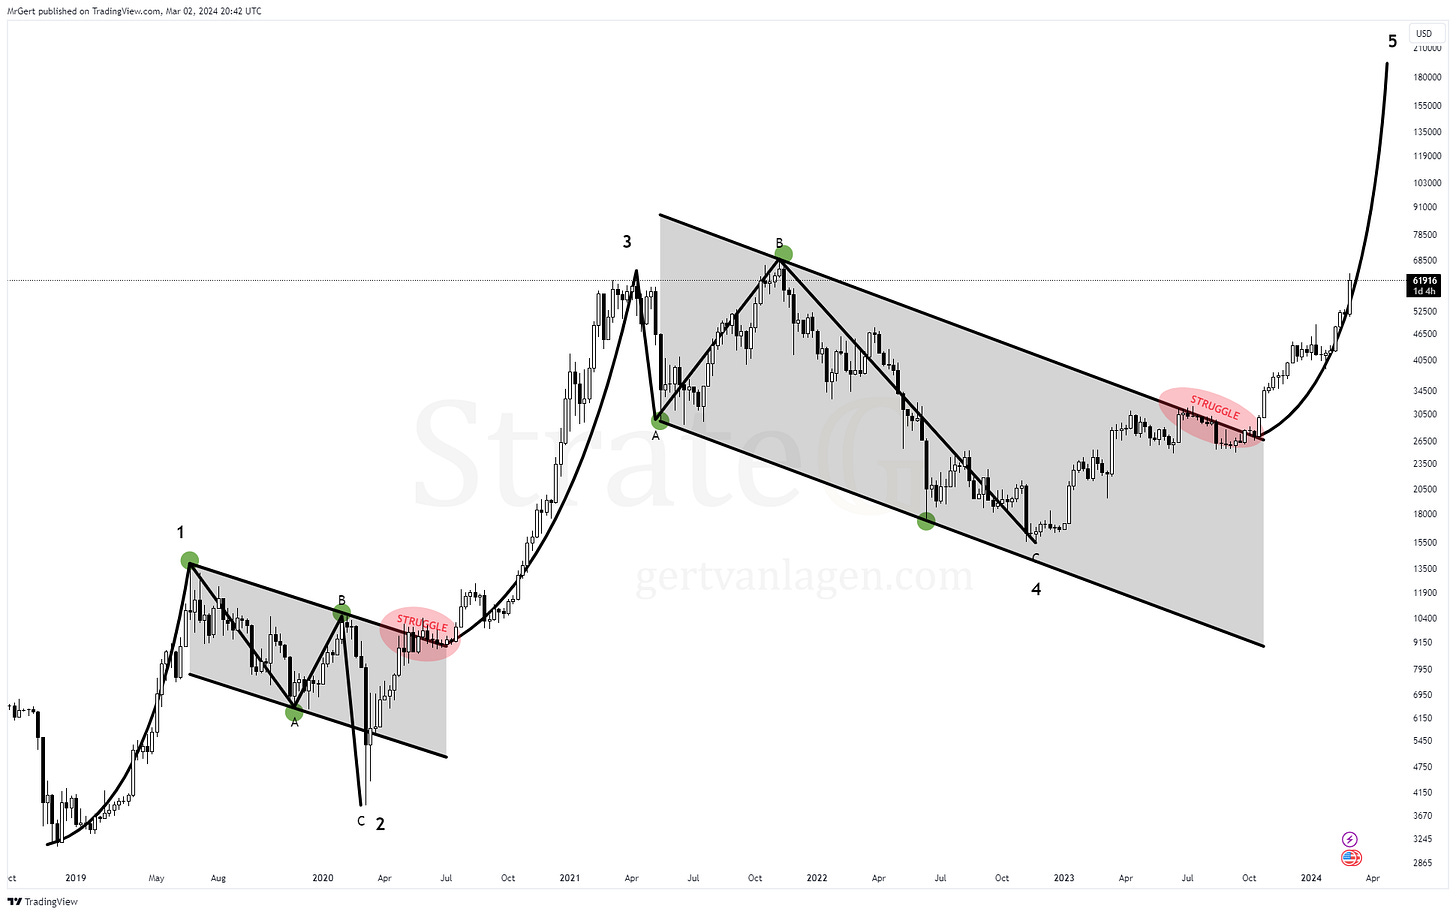
Price keeps tracking the parabolic surge of W5 before the halving. After the struggle of months (compare red circles), Bitcoin has succeeded to overcome the gravitation of the 2.25Y+ descending channel.
The main Fibonacci extension targets of W4 are at $150k, $170k and $220k, where the last one aligns closely with the upper trendline of the supermacro channel on the symmetrical log scale.
It's important to note that the key point is that there's one final impulse left.
Here the updated chart:
Elliottwave count:
W1: 1st impulse
W2: 1st correction (zigzag, sharp)
W3: 2nd impulse (momentum)
W4: 2nd correction (expanded flat)
W5: 3rd impulse (blow-off, next up)
Flat correction?
Regarding the nature of the correction, yes, W4 retraced only 50% of W3 in a complex expanded flat pattern of ABC. In contrast, W2 was a sharp zigzag correction, retracing 90% of W1.
Step-like formation - Update
BTC still follows the parabolic structure to reach $200k before May this year. The long awaited impulsive bust to $60k+ in the shortest period of time has played out neatly. Note that the sketched trajectory is a structural expectation, not exactly timewise.
Here the updated chart:
Elliottwave count:
Wave 1: Base 1 to Base 3
Wave 2: Base 3 (Flat)
Wave 3: Base 3 to Base 4
Wave 4: Base 4 (Likely sharp)
Wave 5: Base 4 to SELL POINT


