Strate𝔾 Update - Week 13 | Q1 | 2024
"Bitcoin bounces successfully from previous ATH."

Please note that while I can provide information and insights based on my knowledge, it's important to remember that I cannot offer specific financial advice. #nfa
You can follow me also on Instagram: link
Strate𝔾 Channel update MARCH : LINK TO YOUTUBE
Key take aways
BTC bounces successfully after test previous ATH
Altcoins are about to pop
S&P 500 and Nasdaq-100 both print fresh ATHs.
Is cash recession proof?
I'd love to hear your thoughts or any suggestions you have for this newsletter! What rabbit hole should be explored in the next release?
News of this week
Presidential candidate RFK Jr. advocates for cryptocurrency as the top hedge against inflation.
The London Stock Exchange plans to introduce a market for exchange-traded notes (ETNs) for Bitcoin and Ethereum.
Nilam Resources, a South American gold mining company, intends to purchase 24,000 Bitcoin valued at $1.7 billion.
Kucoin and two of its founders face criminal charges from the US Government, alleging involvement in a "multibillion-dollar criminal conspiracy."
The Commodity Futures Trading Commission (CFTC) classifies Ethereum and Litecoin as commodities in the Kucoin lawsuit.
BlackRock's CEO notes their Bitcoin exchange-traded fund (ETF) as the fastest-growing in history.
FTX founder Sam Bankman-Fried receives a 25-year prison sentence.
Tweet of this week —> “Many are tragically failing to recognize that the current parabolic surge is not the dawn of a fresh cycle, but rather the culmination of a 15-year journey.”
Current status 100% Winning strategy: 🔵—> ALL-IN
Bitcoin
In this chart the Bitcoin price is shown in black. In colors you see the Long Term Holder NUPL (legend in caption figure), which is a great indicator to assess whether price is near a macro top or bottom. Now the LTH-NUPL is almost entering the Euphoria phase, a phase in which price historically almost went vertical after breaking previous ATH’s. Yet another star aligning to my thesis of BTC being in a final blow-offwave which is about to go vertical, all before entering a big recession.
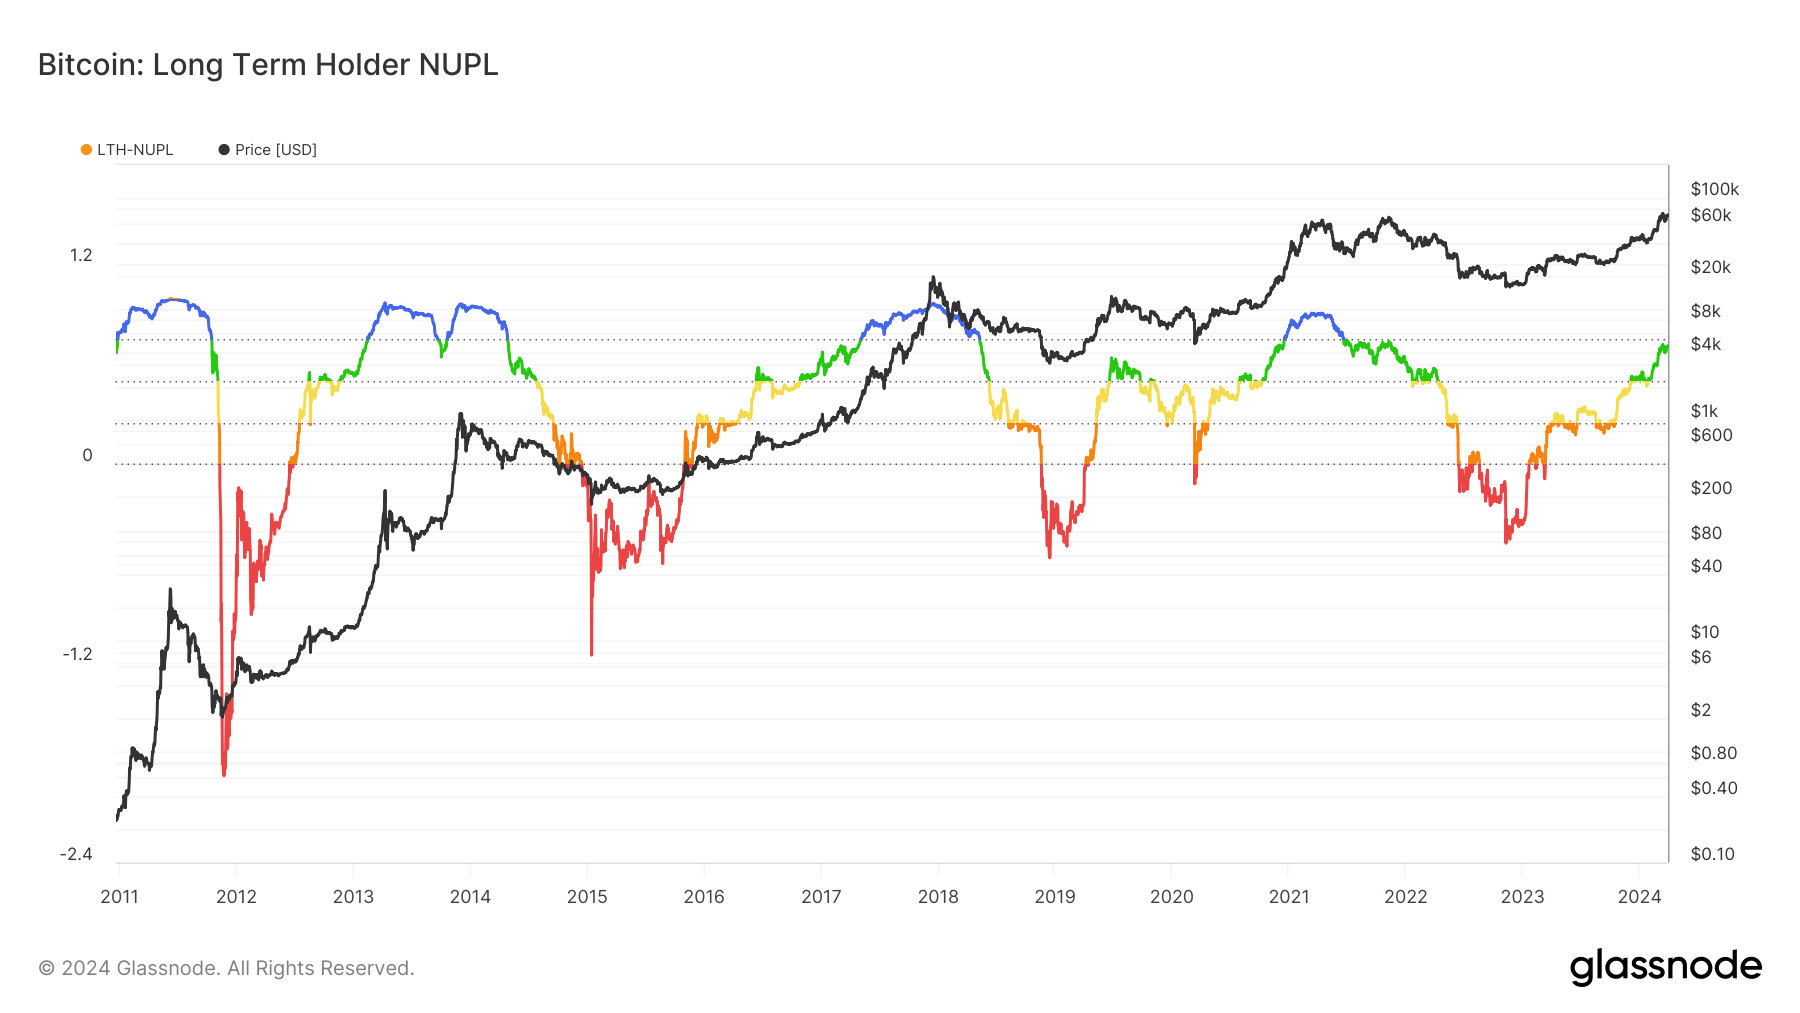
Long Term Holder NUPL (LTH-NUPL) is Net Unrealized Profit/Loss that takes into account only UTXOs (transactions) with a lifespan of at least 155 days and serves as an indicator to assess the behavior of long term investors. For more information see this article.
The chart below stresses also the point that BTC is finalizing the bullrun started at the 2018 bear market bottom.
If comparing bear market recoveries without this in mind, things don’t line up at the moment. Price has reached an ATH prior to the halving, which usually occurs months after the halving.
That’s why I’m comparing previous cycle starts with one another started at the bear market bottoms of 2011, 2015 and 2018.
2011-2014: struggle at green zone and 1.618;
2015-2017: struggle at green zone and 1.618;
2019-2024: struggle at green zone and major struggle at 1.618.
The first and second cycles after breaking the 1.618 line surged within 2-3 months to the cycle peak at 2.272.
Currently $BTC has broken well above the 1.618 level at $62k and has maintained well above it for four weeks already.
Conclusion: A surge to $200k at the 2.272 level within 3 weeks from now isn’t off the table. On the contrary! Everything lines up for it to play out.

But what if price won’t hit $200k before the halving? Then the target of wave 5 increases by the Elliottwave channeling method. The 900.000 blocks vertical aligns with the $300k price level. Hence I’d project a cycle top mid 2025 at this price level. (60.000 blocks after the halving /= 416 days after the halving). Wave (5) would in this case be out of balance with wave (3), so I highly doubt this scenario will play out, especially because there are a lot of signs pointing at an imminent recession starting in 2024 or H1-25.

2Y+ channel - Update
Price keeps tracking the parabolic surge of W5 before the halving. After the struggle of months (compare red circles), Bitcoin has succeeded to overcome the gravitation of the 2.25Y+ descending channel.
The main Fibonacci extension targets of W4 are at $150k, $170k and $220k, where the last one aligns closely with the upper trendline of the supermacro channel on the symmetrical log scale.
It's important to note that the key point is that there's one final impulse left, which has now been validated by printing an ATH.
Here the updated chart:

Elliottwave count:
W1: 1st impulse
W2: 1st correction (zigzag, sharp)
W3: 2nd impulse (momentum)
W4: 2nd correction (expanded flat)
W5: 3rd impulse (blow-off, next up)
Flat correction?
Regarding the nature of the correction, yes, W4 retraced only 50% of W3 in a complex expanded flat pattern of ABC. In contrast, W2 was a sharp zigzag correction, retracing 90% of W1.
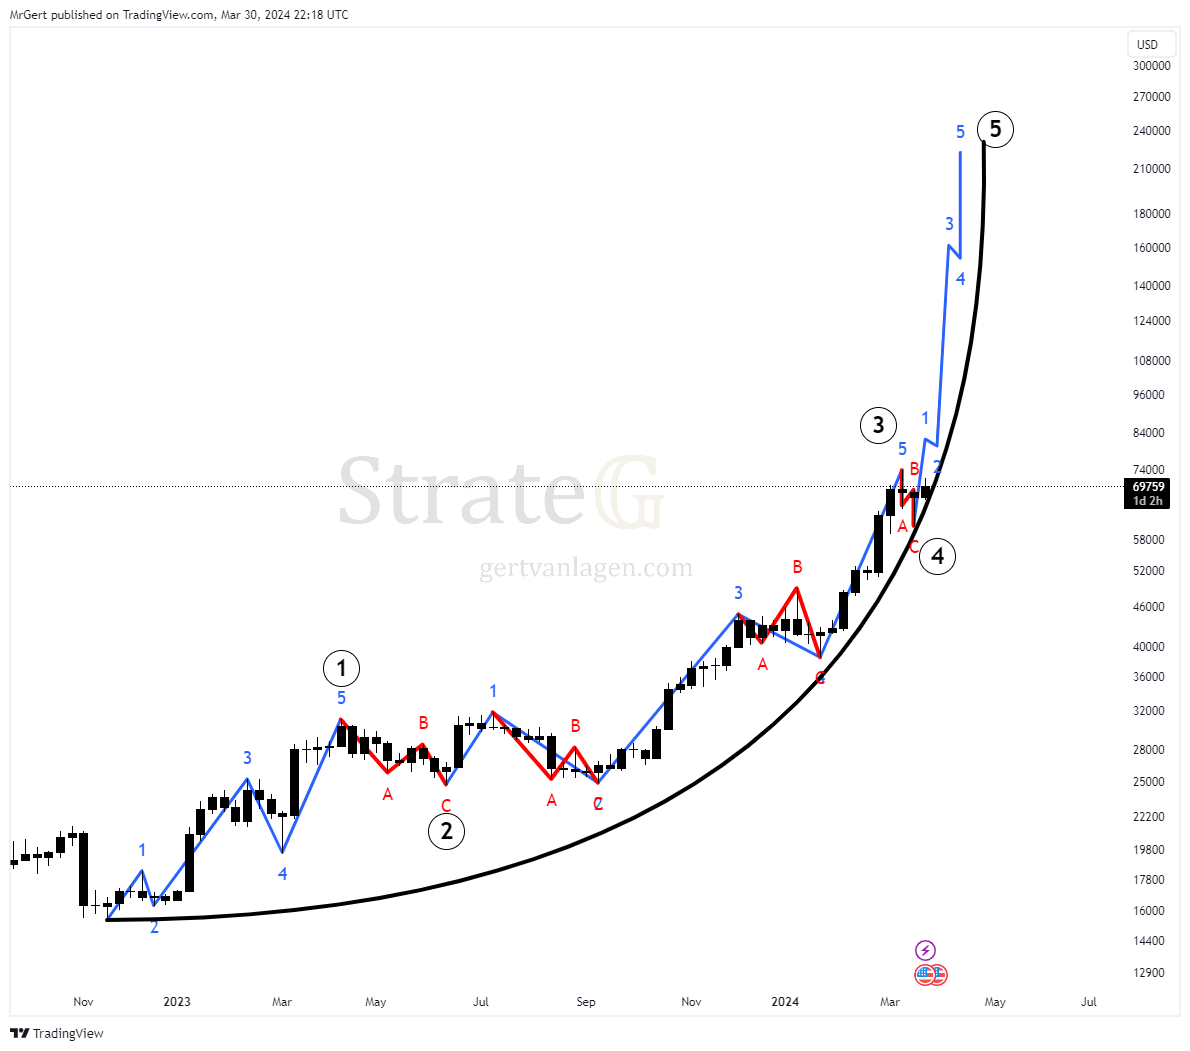
Step-like formation - Update
BTC still follows the parabolic structure to reach $200k before May this year. The long awaited impulsive bust to $60k+ in the shortest period of time has played out neatly. Note that the sketched trajectory is a structural expectation, not exactly timewise.
Here the updated chart: